What makes a song successful?
In 2021, two classmates and I explored whether a song’s sound could tell us if it would be a hit. We combined Spotify audio features with Billboard Hot 100 records, assembled a balanced dataset of 4,940 songs, and trained models including XGBoost and a neural network. We also used feature-importance analysis and SHAP to better understand what the models relied on when predicting chart hits.¹
Our initial findings showed that XGBoost relied on loudness, song duration, and speechiness, while the neural network’s SHAP explanations emphasized danceability and loudness. The models were finding different patterns that distinguished chart hits in our dataset, not necessarily discovering what makes a song successful. However, the neural network reached around 94% accuracy on training songs and 52% on test songs. We recognized possible overfitting, yet argued in the original write-up that test accuracy mattered less because we cared about interpretation. I ended up getting an A in John Dickerson’s Data Science class, but looking back, if the model can’t generalize, can we trust its explanation?¹
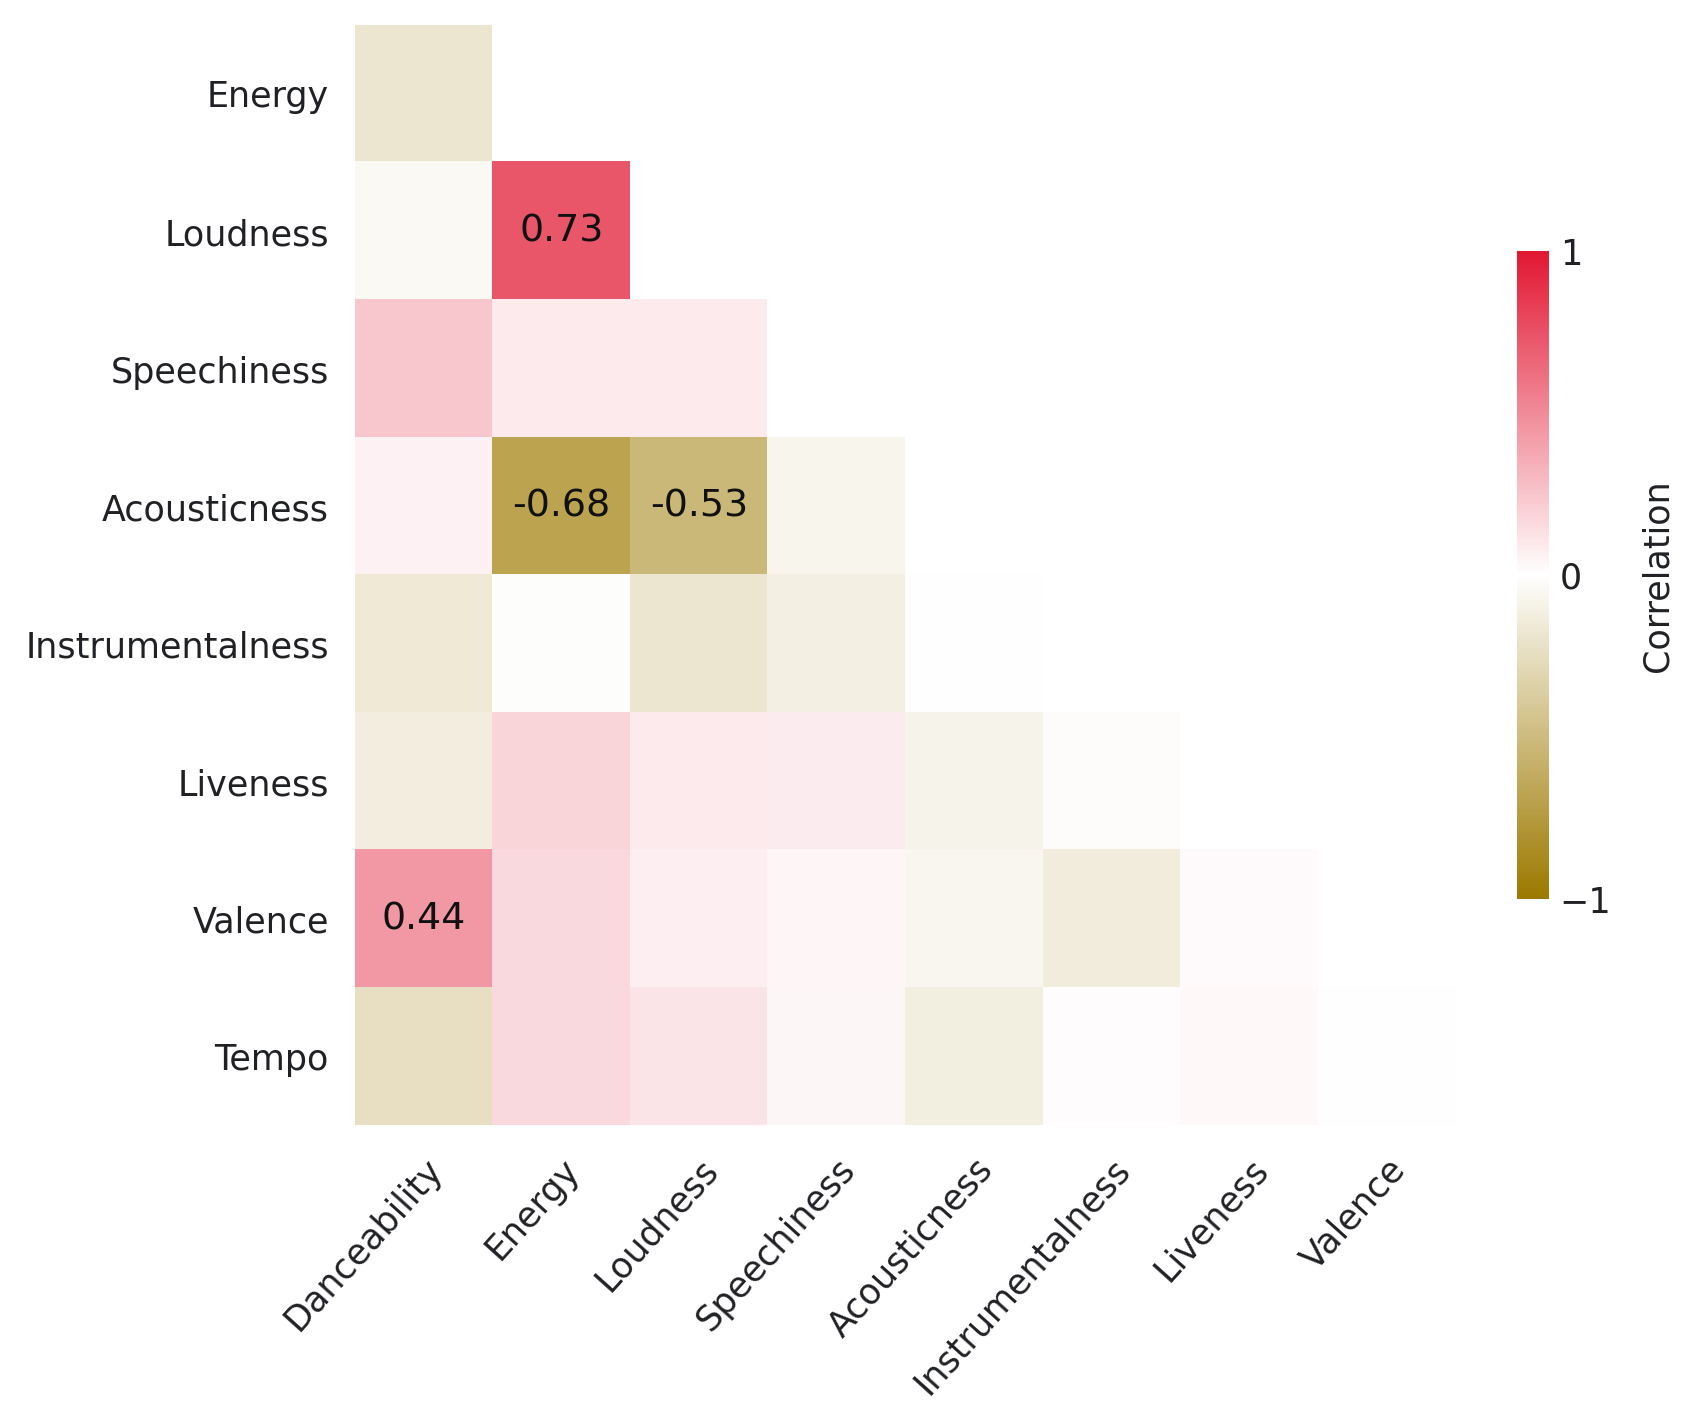
Correlations among Spotify audio features in our 2021 dataset.
Garbage in, garbage out?
After taking Machine Learning in 2026, I revisited the notebook and found problems with how we’d labeled songs, prepared features, and evaluated our models.
A few questionable choices stood out:
- We matched songs to Billboard records by title alone, even though two artists can have songs with the same name. We also removed duplicates by title, discarding tracks with the same name regardless of artist or recording.
- We scaled features before splitting the data, allowing information from the test set to influence preprocessing. This is a form of data leakage.
- We deliberately selected equal numbers of charting and non-charting songs. That wasn’t inherently wrong, but it meant our test no longer reflected the class balance in the source data.²
For the revisit, I deduplicated by track ID, matched both title and artist, and excluded unresolved matches rather than guessing. I fitted preprocessing on training data only and kept the class proportions remaining after filtering instead of forcing a 50/50 balance. I also repeated the evaluation across several splits, including tests on artists the models hadn’t seen during training.²
What changed?
On the unseen-artist tests, audio features alone reached 0.703 ROC-AUC, while adding genre raised the score to 0.767. A ROC-AUC of 0.703 means the model ranked a randomly chosen charting song above a non-charting one about 70% of the time. Genre alone reached 0.686; we’d dropped it as unhelpful in 2021, so its contribution here was a reminder that a feature’s apparent value depends on how we test it.²
The original 52% test accuracy and the new 0.767 ROC-AUC aren’t directly comparable because they measure different things, and the dataset and evaluation changed.
The model still made major mistakes. It gave The Monkees’ “I’m a Believer” a score of 0.010 and Billie Eilish’s “everything i wanted” a score of 0.011, despite both songs appearing in the chart records. In other words, it assigned near-zero chart scores to actual hits.³
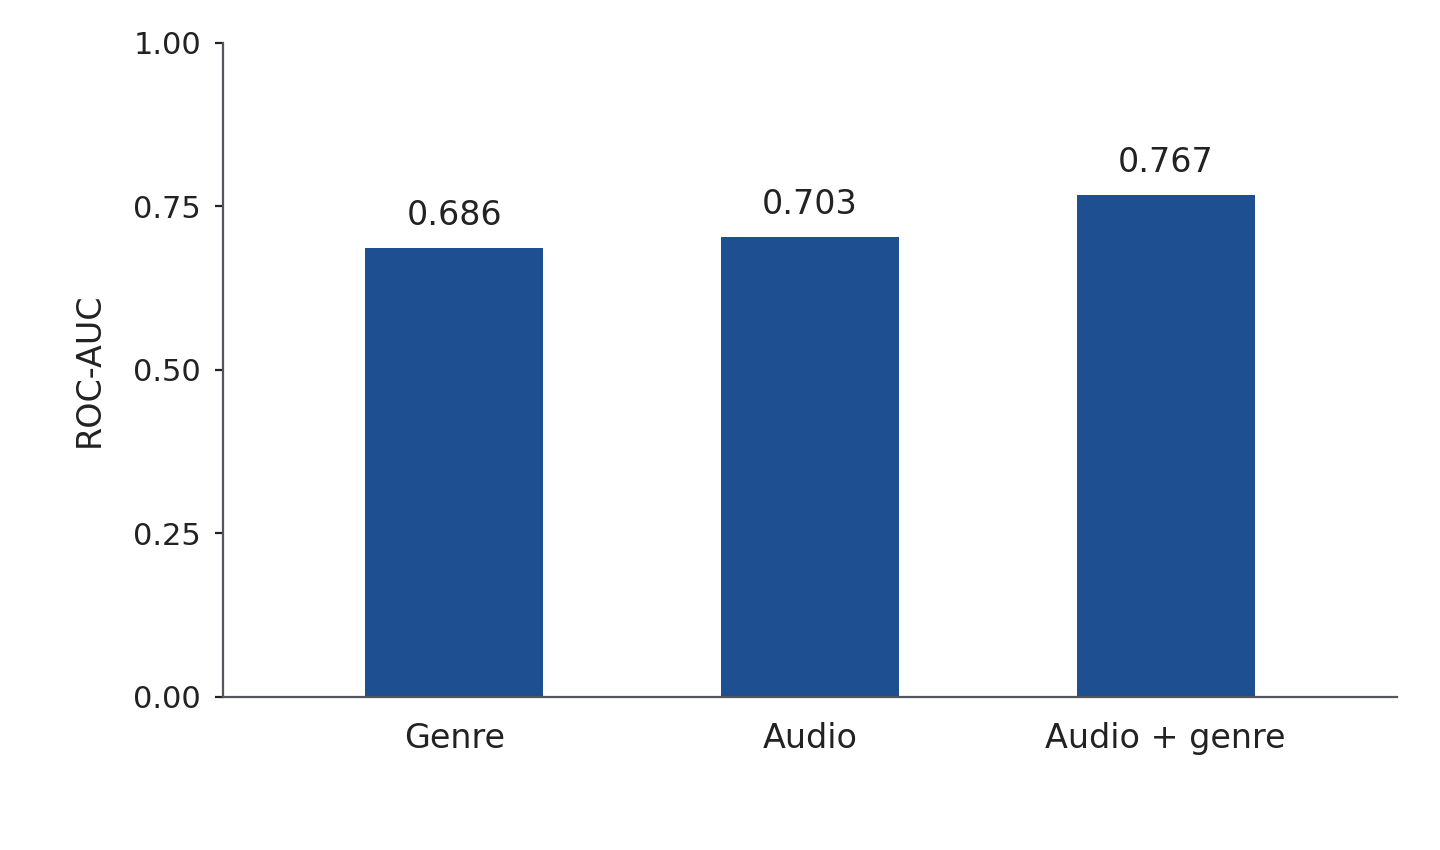
Mean ROC-AUC across three unseen-artist splits.
But what even counts as success?
As a researcher, I’m interested in grounding an evaluation in what we’re actually trying to measure. We’d used “made the Billboard Hot 100” as our definition of success, which is a reasonable starting point, but a chart appearance isn’t the same thing as reaching a large audience or having listeners return to a song. A song you keep playing might never have charted, while a chart hit might be something you heard once and never sought out again.
I explored that distinction using 7,280 eligible tracks from HSP-S, a separate dataset published by researchers at the University of Innsbruck that combines audio features, Billboard records, and Last.fm listening counts. I compared chart membership, listener reach, and repeat listening.⁴
Charting and belonging to the higher-repeat-listening group had a correlation of just −0.017, essentially zero. In this dataset, appearing on the charts told us very little about whether a song had high plays per listener.⁵
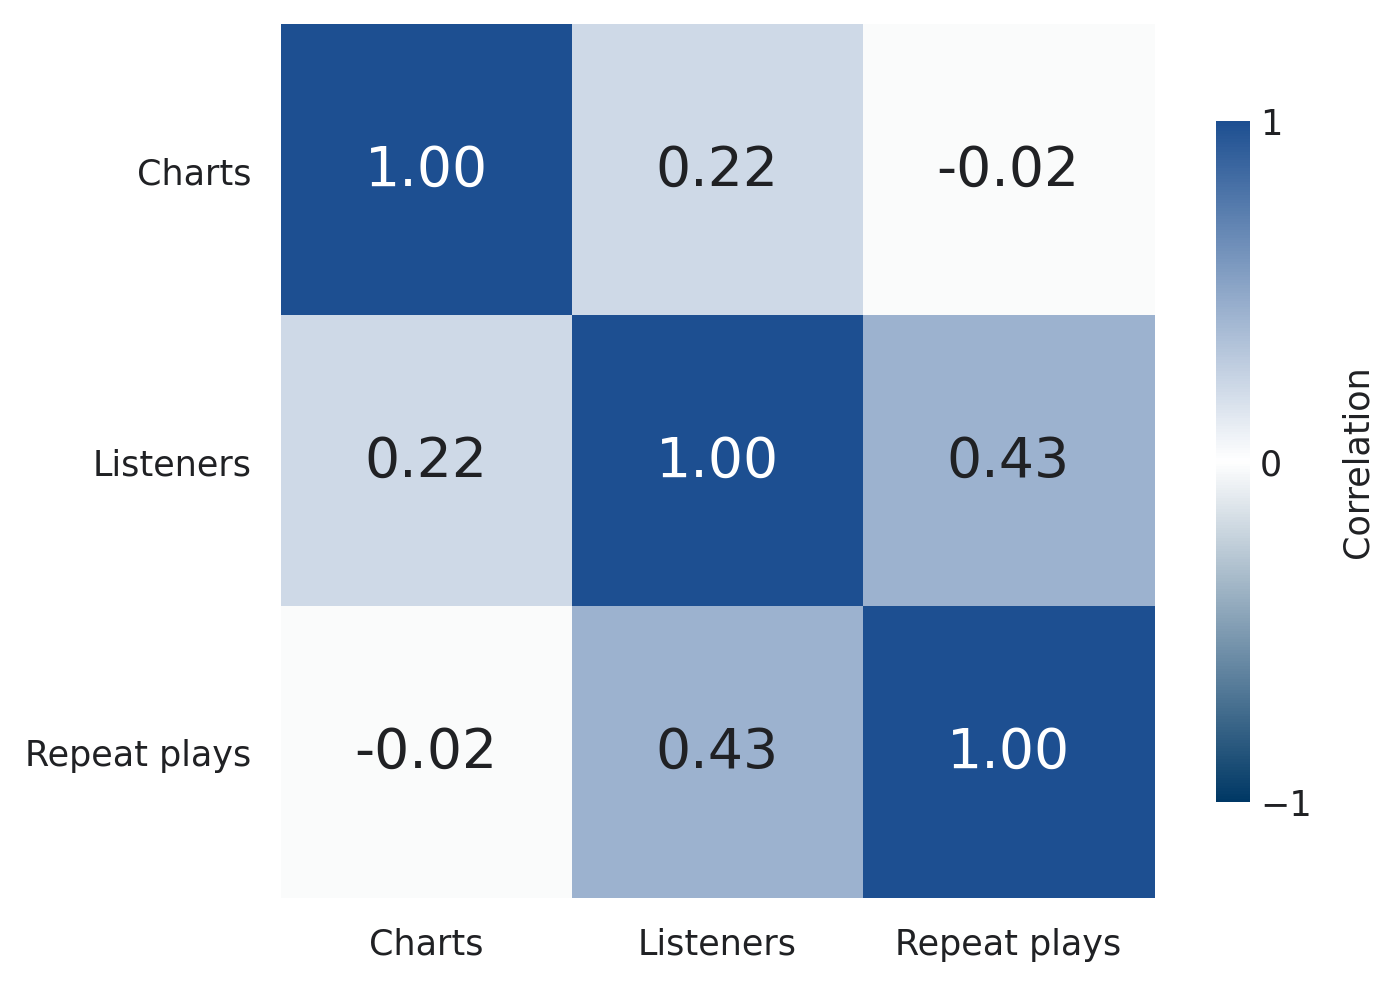
Correlations among three definitions of success in HSP-S.
Christina Aguilera’s “Back in the Day” is labeled a non-hit in the dataset, yet it has more than 112,000 listeners and nearly 11 plays per listener. Under a chart-only definition, all of that listening counts as a zero.⁵
Then I tried removing the 10% of training songs estimated to be least helpful for predicting charts. In the main test, that improved chart predictions but made both listener-reach and repeat-listening predictions worse. The same training example could be helpful or harmful depending on the goal. That was much more interesting to me than another feature-importance ranking.⁵
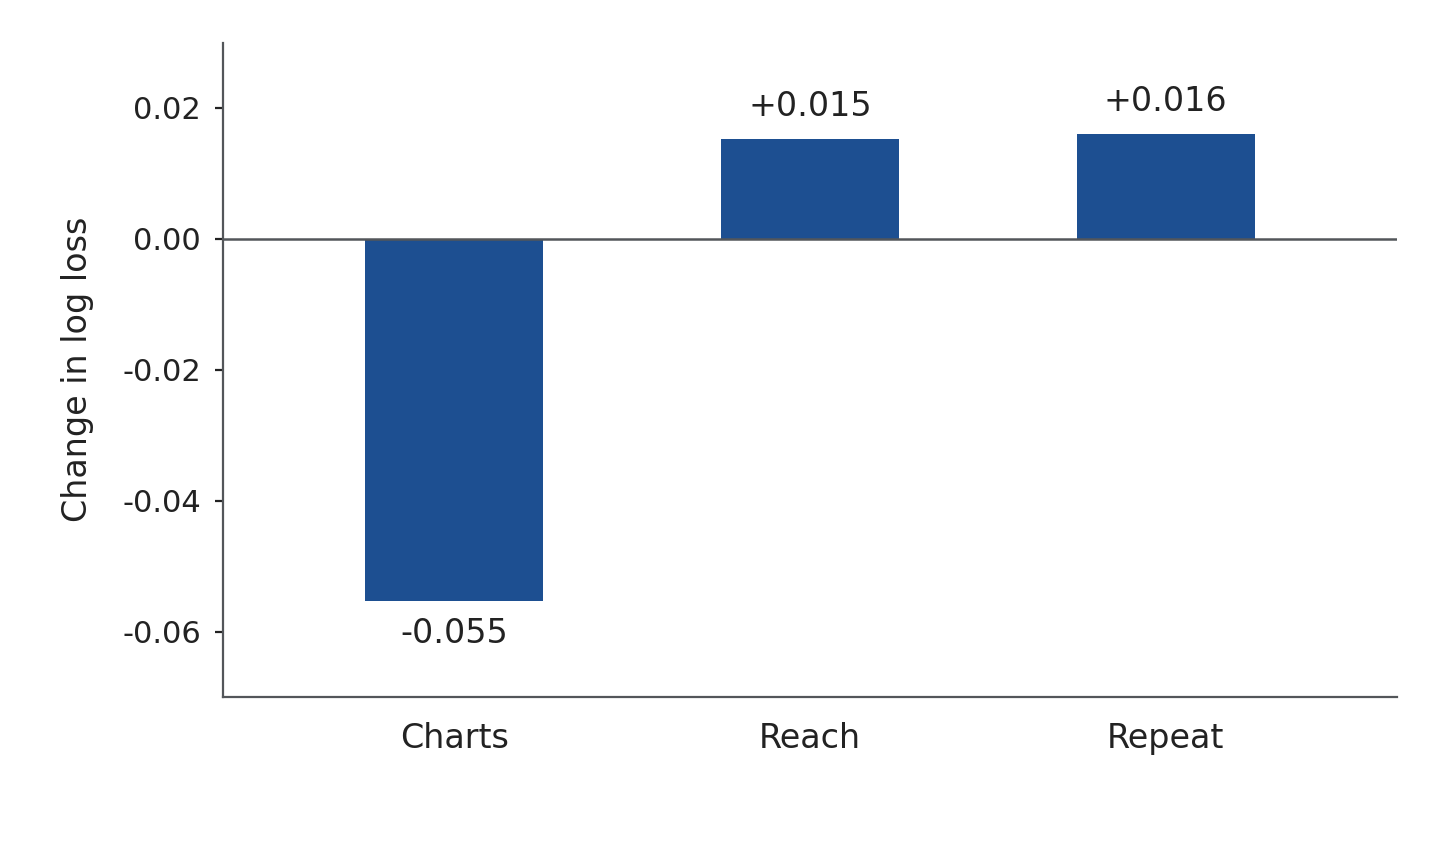
Chart-focused removal helped chart predictions but hurt both listening measures in the main test.
Keeping every training song and simply adjusting the chart model’s confidence produced lower log loss than removing examples across six historical checks. Removing supposedly unhelpful songs wasn’t the best fix. Revisiting the project made me more careful about whether our definition of success and our evaluation actually justified what we claimed the model had learned.⁵
References
- Original 2021 notebook, model results and SHAP.
- 2026 revisit, data audit and unseen-artist tests.
- Song predictions, “Biggest misses.” Raw scores against historical chart labels, not calibrated probabilities.
- Vötter et al. (2021), HSP-S. The analysis retained 7,280 eligible tracks.
- 2026 revisit, Part II. Listening data are historical; “non-hit” is a dataset label, and the cross-goal results are exploratory.